
File:Hash table average insertion time.png

原始檔案 (954 × 620 像素,檔案大小:5 KB,MIME 類型:image/png)

|
本圖片是以PNG、GIF或JPEG格式上傳。然而,其中包含的資料或訊息,應該重新建立成可縮放向量圖形(SVG)檔案,以更有效率或更準確的方式儲存。如有可能,請上傳本圖片的SVG格式版本。在上傳之後,請修改維基各姊妹計畫中所有使用舊版圖片的條目(列在圖像連結章節中),替換為新版圖片,並在舊圖片的描述頁中加入{{Vector version available|新圖片名稱.svg}}模板,同時移除本模板。
|
摘要
| 描述 |
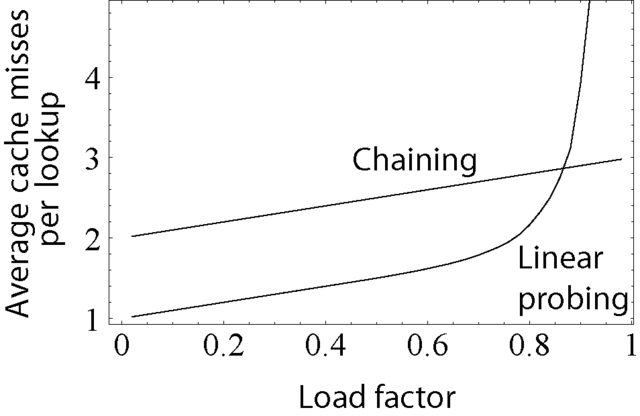
Shows the average number of cache misses expected when inserting into a hash table with various collision resolution mechanisms; on modern machines, this is a good estimate of actual clock time required. This seems to confirm the common heuristic that performance begins to degrade at about 80% table density. Created in Mathematica, Illustrator, and Photoshop. It is based on a simulated model of a hash table where the hash function chooses indexes for each insertion uniformly at random. The parameters of the model were:
For modern CPUs, which have many kilobytes of L1 cache, same logic applies for tables far bigger than size of the cache. You may be curious what happens in the case where no cache exists. In other words, how does the number of probes (number of reads, number of comparisons) rise as the table fills? The curve is similar in shape to the one above, but shifted left: it requires an average of 24 probes for an 80% full table, and you have to go down to a 50% full table for only 3 probes to be required on average. This suggests that in the absence of a cache, ideally your hash table should be about twice as large for probing as for chaining. |
||
| 來源 |
Author's Own Work. 本PNG 點陣圖使用Mathematica創作。 |
||
| 作者 | Derrick Coetzee (User:Dcoetzee) | ||
| 授權許可 (重用此檔案) |
|
Mathematica Coding
Because the linear probing values varied widely according to the random choices used to fill the table, I took the average value over 25 runs. The (rather inefficient) Mathematica code used to generate the table follows:
<<Statistics`DescriptiveStatistics`;

f[tablesize_,points_,cachewords_]:=
  Module[{i,r,j,compares1,compares2,k,slots1,slots2},
    slots1 = Table[0,{i,1,tablesize}];
    slots2 = Table[0,{i,1,tablesize}];
    Table[
      For[i=0,i<Floor[Length[slots1]/(points+1)],i++,
        r=Random[Integer,{1,Length[slots1]}];
        slots1[[r]]++];
      For[i=0,i<Length[slots1]/(points+1),i++,
        r=Random[Integer,{1,Length[slots2]}];
        For[j=r,slots2[[j]]>0,j=If[j\[Equal]Length[slots2],1,j+1]];
        slots2[[j]]++];
      compares2=0;
      For[i=1,i<=Length[slots2],i++,
        For[j=i,slots2[[j]]>0,j=If[j\[Equal]Length[slots2],1,j+1]];
        compares2+=
          Ceiling[If[j\[GreaterEqual]i,j-i,j+Length[slots2]-i]/cachewords]];
      {N[Apply[Plus,slots1]/Length[slots1]]+2,
        N[compares2/Length[slots2]]+1},{k,1,points}]];

t=Table[f[1000,49,16],{i,1,25}];
Export["Hash_table_average_insertion_time.eps",
  Show[Map[ListPlot[#,PlotJoined\[Rule]True,Frame\[Rule]True,
          FormatType\[Rule]TraditionalForm,
          FrameLabel\[Rule]{"Density of table",
              "Average cache misses per insertion"},Axes\[Rule]False]&,
      Table[{i/50,Mean[Table[t[[k,i,j]],{k,1,Length[t]}]]},{j,1,2},{i,1,
          Length[t[[1]]]}]]]]
檔案歷史
點選日期/時間以檢視該時間的檔案版本。
| 日期/時間 | 縮圖 | 尺寸 | 用戶 | 備註 | |
|---|---|---|---|---|---|
| 目前 | 2011年2月25日 (五) 23:52 | | 954 × 620(5 KB) | Perhelion | test PNGOUT plugin |
| 2005年11月9日 (三) 05:16 |  | 954 × 620(12 KB) | Dcoetzee | Upload bigger version, add 1 to chaining line (due to external storage), change labels | |
| 2005年11月8日 (二) 01:49 |  | 250 × 162(6 KB) | Dcoetzee | Shows the average number of cache misses expected when inserting into a hash table with various collision resolution mechanisms; on modern machines, this is a good estimate of actual clock time required. This seems to confirm the common heuristic that per |
檔案用途
下列頁面有用到此檔案:
全域檔案使用狀況
以下其他 wiki 使用了這個檔案:
- enbaike.710302.xyz 的使用狀況
- en.wikibooks.org 的使用狀況
- sk.wikipedia.org 的使用狀況
- uk.wikipedia.org 的使用狀況